

How To Work With Indicators – Tradimo
Original price was: $588.00.$83.00Current price is: $83.00.
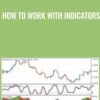
In StockIndicators are a set of tools applied to a trading chart that help make the market more clear.
For example, they can confirm if the market is trending or if the market is ranging.
Description
Accelerate your learning with the How To Work With Indicators - Tradimo course, priced at just Original price was: $588.00.$83.00Current price is: $83.00. on ESYSGB.com! Explore our extensive catalog of over 60,000 downloadable digital courses across Uncategorized. Experience flexible, self-paced learning from experts and save over 80%. Empower your future today!
About this course
What are indicators?
Indicators are a set of tools applied to a trading chart that help make the market more clear.
For example, they can confirm if the market is trending or if the market is ranging.
Indicators can also provide specific market information such as when an asset is overbought or oversold in a range, and due for a reversal.
In this course you will learn:
- Lagging and leading indicators
- Trending indicators
- Oscillating indicators
- When to use trending and oscillating indicators
- Combining indicators correctly
- Using divergence for trading
Course Curriculum
MODULE 01
Introduction
-
Overview
-
Quiz: Introduction
MODULE 02
Trending indicators
- Moving average: using them to trade
- Quiz: Moving average
- Fractals indicator
- Quiz: Fractals
- Parabolic SAR
- Quiz: SAR
- MACD
- Quiz: How to use MACD
- ADX: determing the strength of price movement
- Quiz: ADX
- Andrew´s Pitchfork indicator
- Quiz: Andrew's Pitchfork
- Pivot points
- Quiz: PP
- How to trade with Fibonacci levels
- Quiz: Fibonacci levels
MODULE 03
Oscillating indicators
- Stochastic oscillator
- Quiz: Stochastic
- RSI indicator
- Quiz: RSI
- CCI indicator
- Quiz: CCI
- Accumulation distribution indicator (ADI)
- Quiz: ADI
- The Gator oscillator
- Quiz: The Gator
MODULE 04
Volatility indicators
- Market volatility
- Quiz: Volatility
- Average true range (ATR)
- Quiz: ATR
- Bollinger bands
- Quiz: BB
- Market facilitation index (MFI)
- Quiz: MFI
- The standard deviation indicator
- Quiz: Standard deviation
- Accelerator indicator
- Quiz: Accelerator
MODULE 05
Understanding divergence
- Divergence
- Quiz: What is divergence
- Hidden divergence
- Quiz: What is hidden divergence?
- Webinar: Finding confluence
- Webinar: Hidden divergence
Get How To Work With Indicators – Tradimo, Only Price $87
Tag: How To Work With Indicators – Tradimo Review. How To Work With Indicators – Tradimo download. How To Work With Indicators – Tradimo discount.
Build a robust future with the How To Work With Indicators - Tradimo course at ESYSGB.com! Gain lifetime access to high-impact digital content, meticulously designed to boost your career and personal growth.
- Lifetime Access: Permanent and unlimited access to your purchased courses.
- Exceptional Savings: Enjoy discounts of up to 80% off original prices.
- Secure Payments: Your transactions are fully protected and safe.
- Practical Knowledge: Acquire actionable skills for immediate application.
- Instant Availability: Start learning right after completing your purchase.
- Cross-Device Access: Study seamlessly on any desktop, tablet, or mobile device.
Unlock your potential with ESYSGB.com!
Only logged in customers who have purchased this product may leave a review.
Related products
-

5 Hours 55 Minutes
The United States is facing a situation without precedent: more than 16 million people are living with cognitive impairments and the World-Health Organization estimates that the number will increase to over 30 million by the year 2050, with fewer and fewer people available to care for them. Successful cognitive rehabilitation is crucial to improving overall quality of life—for the patient, family, and caregiver.
Original price was: $199.99.$85.00Current price is: $85.00. -
5 Hours 48 Minutes
A history of mental illness and/or substance abuse are high risk factors for opioid addiction, so the clients we see in our practices every day are more susceptible to the dangerous trap of opioid dependency. With reports of opioid related addictions and deaths on the rise, doctors and their patients are actively searching for alternative ways to manage pain.
Original price was: $199.99.$85.00Current price is: $85.00. -
2 Hours 16 Minutes
The EKG is the most commonly-used procedure for diagnosing a wide variety of cardiac conditions, yet even the most seasoned nurses struggle to master interpretation. In this information-packed program cardiac expert, Cathy Lockett, RN, MHA, BSN, CCRN-K, will teach you easy-to-understand techniques to identify ischemia, injury, infarct and STEMI imposters. Improve your skills and be prepared to respond to the patient emergencies associated with each of these changes.
Original price was: $49.99.$30.00Current price is: $30.00. -
Your guard is up, but you quickly move along when their problems don’t take the form of a full-blown eating disorder like anorexia or bulimia.
Original price was: $199.99.$85.00Current price is: $85.00. -
My 34 page Marketing Plan Training Manual will guide you each step of the way as you implement my plan to get high value business prospects such as Doctors to call you.
Original price was: $372.00.$72.00Current price is: $72.00. -
1 Hour 40 Minutes
Pain is the most common memory patients have when asked about their hospital stay. Help ease their pain and they will be forever grateful. Fail to ease their pain and you will likely hear about it from their family, your supervisor and the score on the survey! You may not be able to give any more medication so now what? In this program, you’ll learn new pharmacologic and non-pharmacologic strategies to manage pain, agitation and delirium. Don’t miss this opportunity to sharpen your skills and improve the care you provide.
Original price was: $59.99.$35.00Current price is: $35.00.
Reviews
There are no reviews yet.